Paul Graham wrote a great essay a few years ago called "Startup equals Growth" and explains why startups should focus on growth. The goal of your startup is to grow your primary metric (the "Northstar" metric). By doing this, it does two things. First, it proves that you are making something a lot of people want. And second, it proves you're making something that has a possibility of reaching and serving all those people. Each week, the goal should be to set a weekly growth rate. Startups early on need frequent feedback and setting a weekly growth rate also helps divide up the work in doable chunks.
In the early days of Pathao, we only focused on our primary north star metric - the number of rides. Because we hit our product-market fit, the number continued to increase exponentially. It was a beautiful thing to watch and be a part of. There was basically unlimited demand because we created a unique category, and the only thing that we had to focus on was to increase our drivers. The more drivers we would increase, the more the number of rides increased.
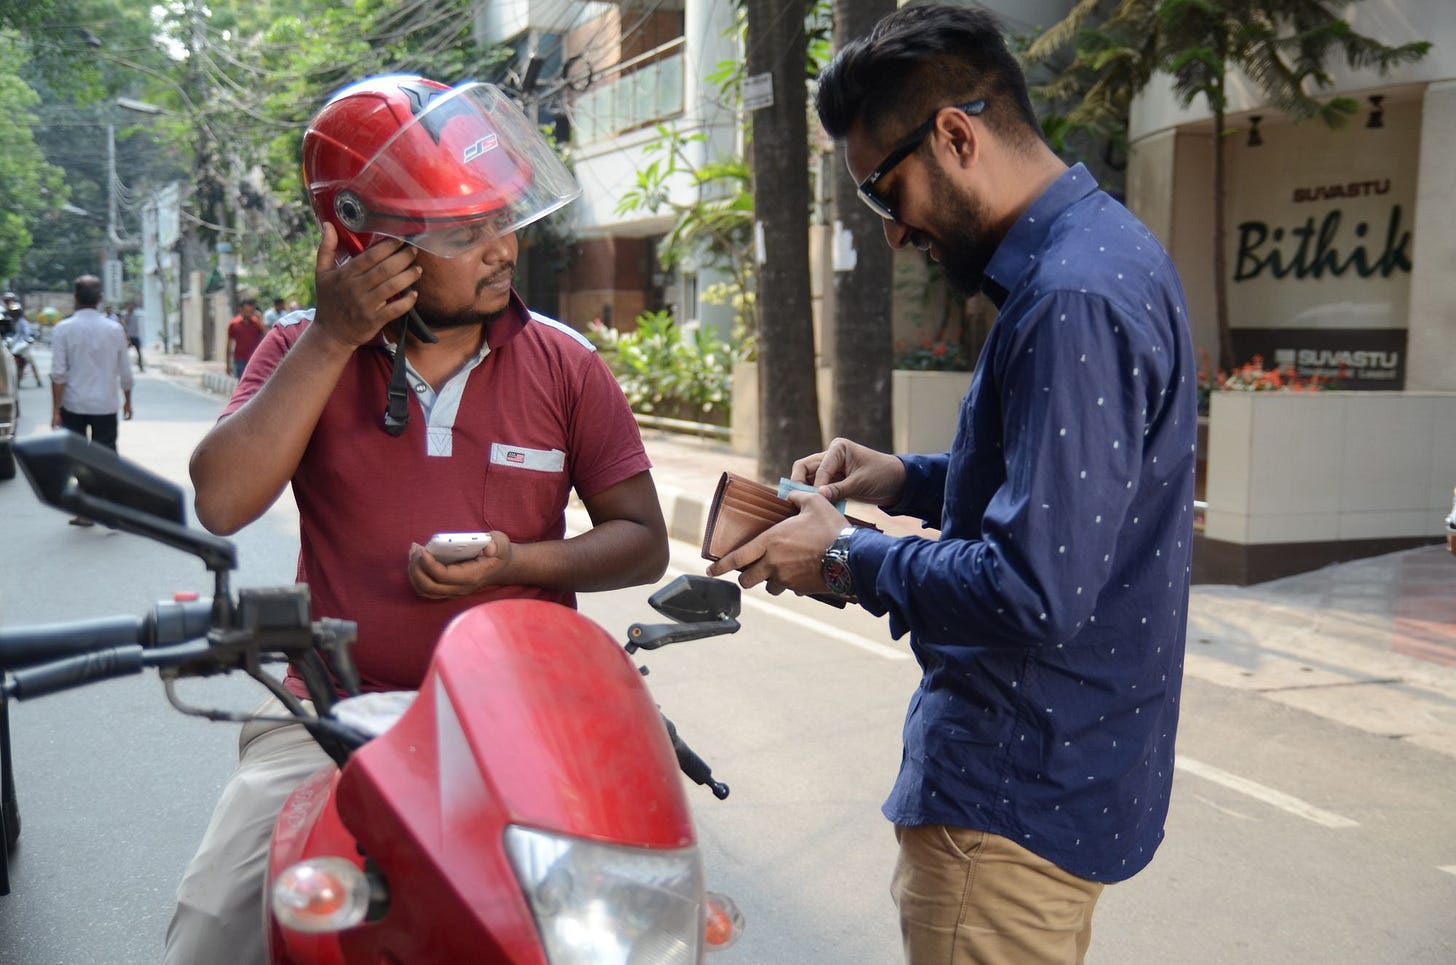
A couple months later however, we started hitting our limit. Our growth started to slowly flat line. Just adding drivers or giving out promo codes wasn't cutting it. Worse yet, the customers were complaining about drivers cancelling rides or not finding rides at their locations or at certain times. Reports started piling up about drivers who, after matching with a ride, would pick up the customer, cancel the ride on app, but finish the ride IRL - cutting out Pathao's commission to pocket the entire amount.
While we had growth metrics, we did not have quality metrics. It was time to introduce the Completion Rate.
Completion Rate equals the percentage of times both the customer and the driver has taken the happy path and closed off a transaction; i.e. a customer looks for a ride, get's it on the first try, the ride is completed and full payment is received.
Once we started tracking quality, the numbers that came out were appalling. Our completion rate was ~ 30%! That meant, for every three times a user in Pathao was looking for a ride, only one would get the intended service. No wonder the number of complaints kept going up!
What follows from there was the breakdown of the completion rate. We started tracking the status (simplified) of:
PENDING - Request sent from user, the user is now actively looking for a ride
ASSIGNED - A driver has agreed to take the ride
PICKING_UP - The driver is now going to the rider location
STARTED - The driver has started with the customer towards destination
COMPLETE - The driver has completed the trip
PAYMENT_RECEIVED - (if digitally paid) log payment received
And then we started calculating deviations within the status changes. For example: if a rider has a pending order for a long time before the trip was assigned, it might mean there was not enough drivers in that area. If the trip has been assigned but cancelled before picking up, it might mean that the driver either did not want to agree to go to the pickup location, or did an off-platform trip; and so on.
Once we dove in to our data, there were some quick fix that helped jump up the completion rate quickly - for example, we auto-logged off drivers if they did not receive any ride for 5 minutes - this dramatically decreased time a customer would have a pending order (since the only drivers still online would be the drivers with the intention to take the ride). Some took a long time to fix (and we are still fixing) - like a driver would receive and cancel rides until he finds a ride that is going to the same location he wants to go (eventually we introduced a feature called Preferred Destinations where drivers could select location they want to go to, which also improved completion rate).
After months of grinding, we got our completion rate to ~85%. On good days, our completion rate would be 90-95%, but never a 100%. Ride-sharing is a very human industry - and anything above 90% was considered fantastic.
As our completion rate started to go up - not only were riders and drivers happier, but it actually helped us to do more trips without increasing the number of drivers. Which makes sense:
100 requests * 0.8 completion rate > 100 requests * 0.3 completion rate
While growth is important, it is not the only metric one should have in a startup. Tracking, and improving, quality helps the bottom line.
Does your startup have a quality metric?

